Nanoscape: a data-driven 3D real-time interactive virtual cell environment
Knowledge of cellular and structural biology has reached unprecedented levels of detail. In conjunction with advances in 3D computer visualisation techniques this has allowed exploration of cellular ultrastructure and environments by a virtual user. The extraction and integration of relevant scientific information, along with consideration of the best representation of data, is often a bottleneck in the visualisation process for many 3D biomedical artists. Here we introduce ‘Nanoscape’, a collaborative project between 3D computer artists, computer graphics developers, and cell biologists that enables a user to navigate a cell in a complex 3D computer visualised environment. We combine actual data from various scientific disciplines (including structural biology, cell biology and multiple microscopic techniques) and apply artistic expression and design aesthetics to create a unique new experience where a real-time virtual explorer can traverse a cell surface, observe and interact with a more scientifically accurate cell surface environment.
View paper: https://www.biorxiv.org/content/10.1101/2020.10.15.340778v1
Created by 3DVAL, UNSW Art and Design, Sydney, Australia, 2019-20.
Shereen R. Kadir (1,2), Andrew Lilja (1,2), Nick Gunn (1,2), Campbell Strong (1,2), Rowan T. Hughes (1,2), Benjamin J. Bailey(1,2), James Rae (3,4), Robert G. Parton (3,4,5), John McGhee,(1,2)
1 3D Visualisation Aesthetics Lab, University of New South Wales Art and Design, Sydney, Australia
2 ARC Centre of Excellence in Convergent Bio-Nano Science and Technology, University of New South Wales, Sydney, Australia
3 Institute for Molecular Bioscience, The University of Queensland, Brisbane, Australia
4 ARC Centre of Excellence in Convergent Bio-Nano Science and Technology, University of Queensland, Brisbane, Australia
5 Centre for Microscopy and Microanalysis, The University of Queensland, Brisbane, Australia
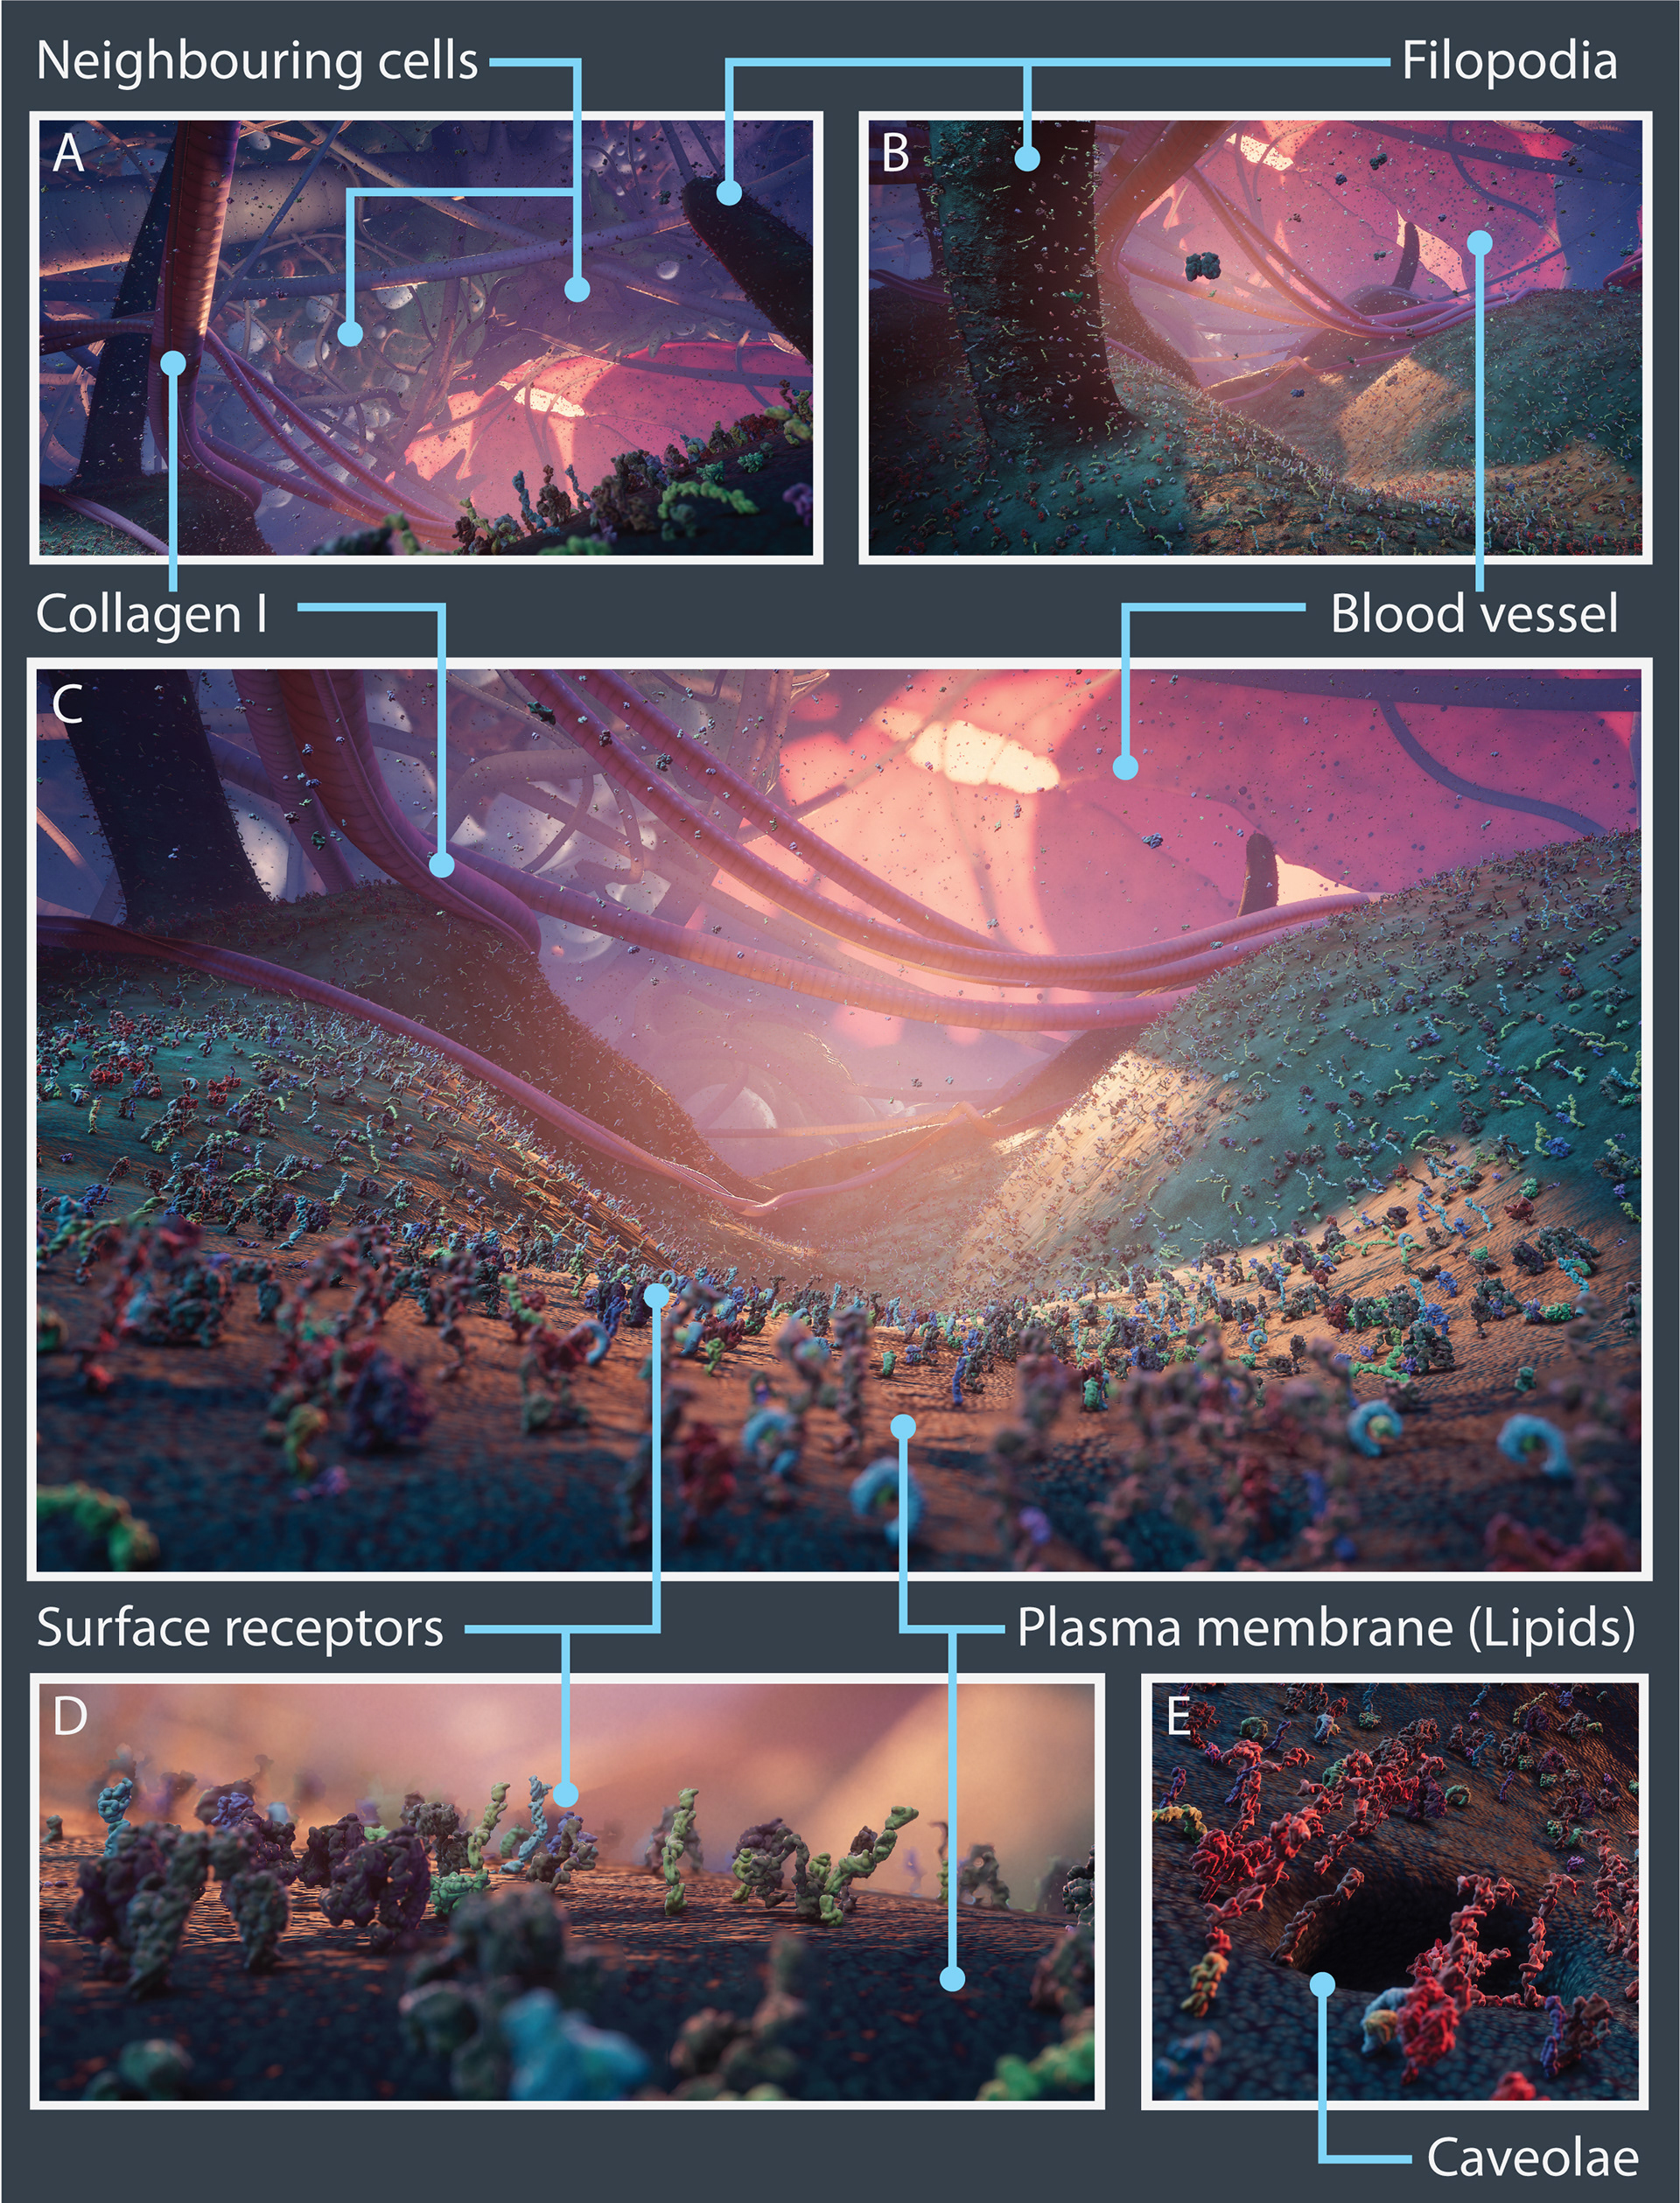
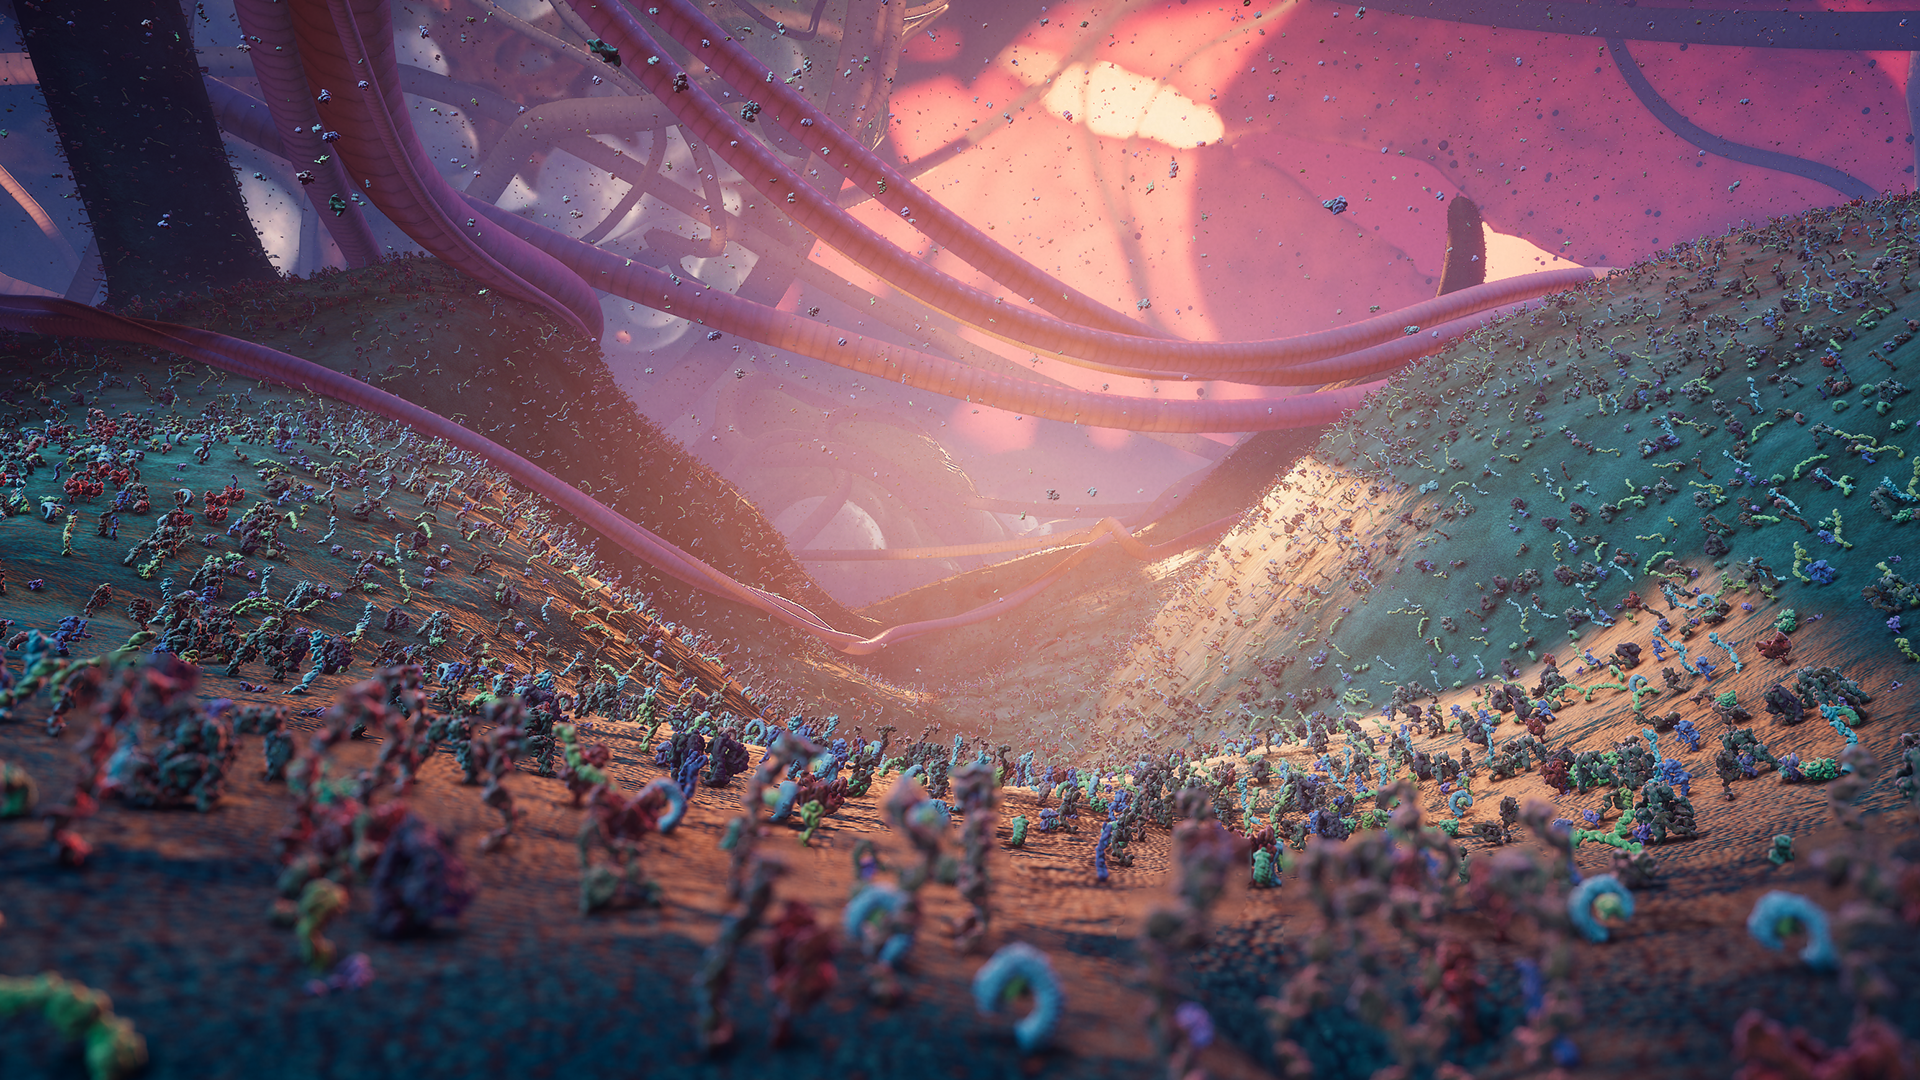
Nanoscape real-time open-world experience.
Vistas from the Nanoscape real-time open-world experience with key cellular features and microenvironment components highlighted. (A – C) Panoramic views of surface receptors, the plasma membrane lipids, neighbouring cancer cells and CAFs, collagen I fibres, blood vessel and filopodia. (D) Close up of surface receptors and lipids.
(E) Close up view of a surface invagination (caveolae).
(E) Close up view of a surface invagination (caveolae).
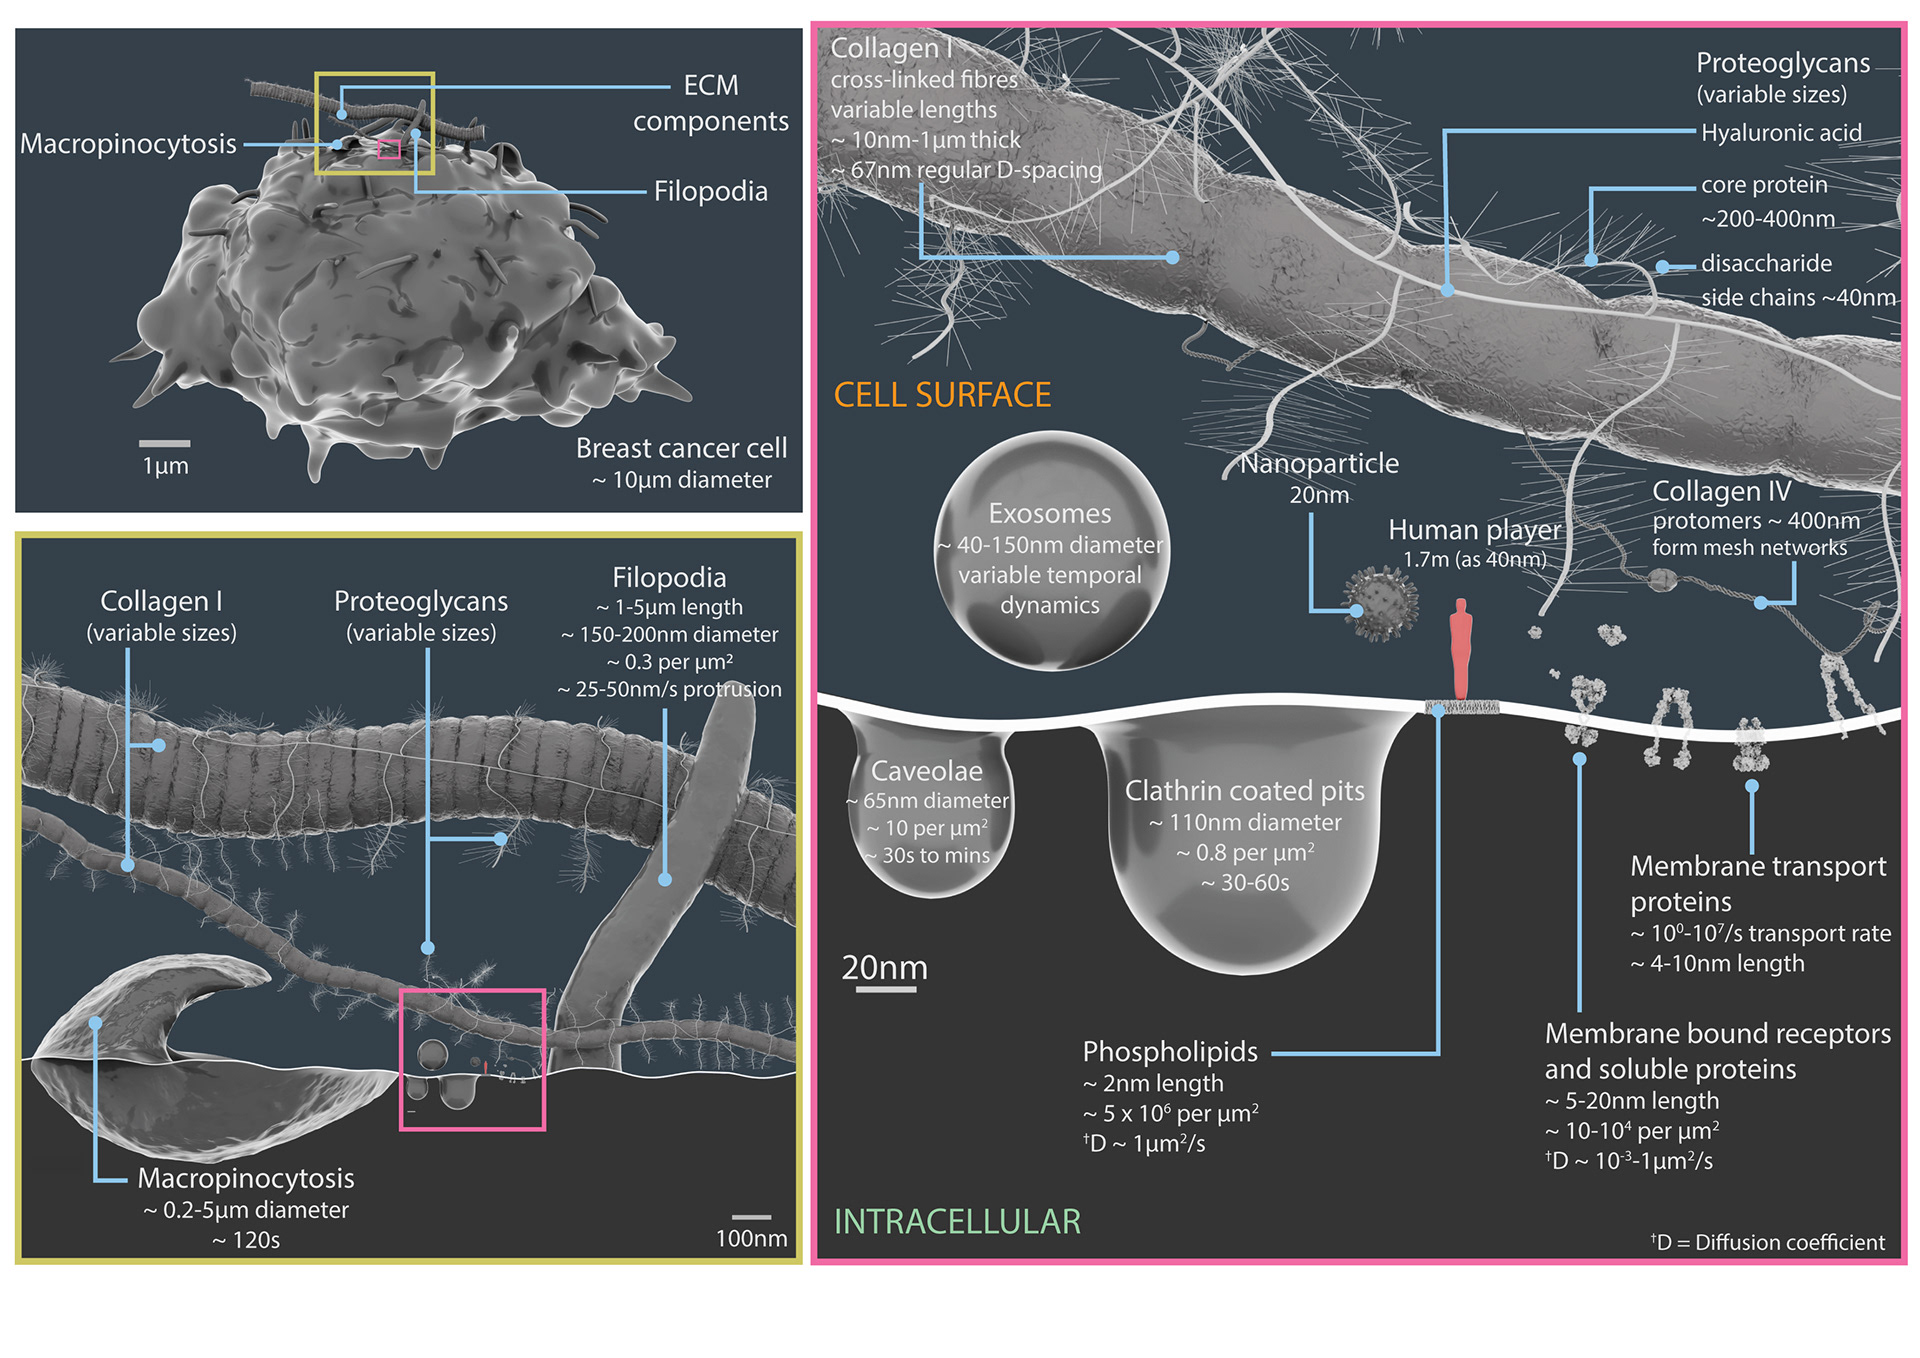
Relative scales and temporal dynamics of 3D cell surface components featured in Nanoscape.
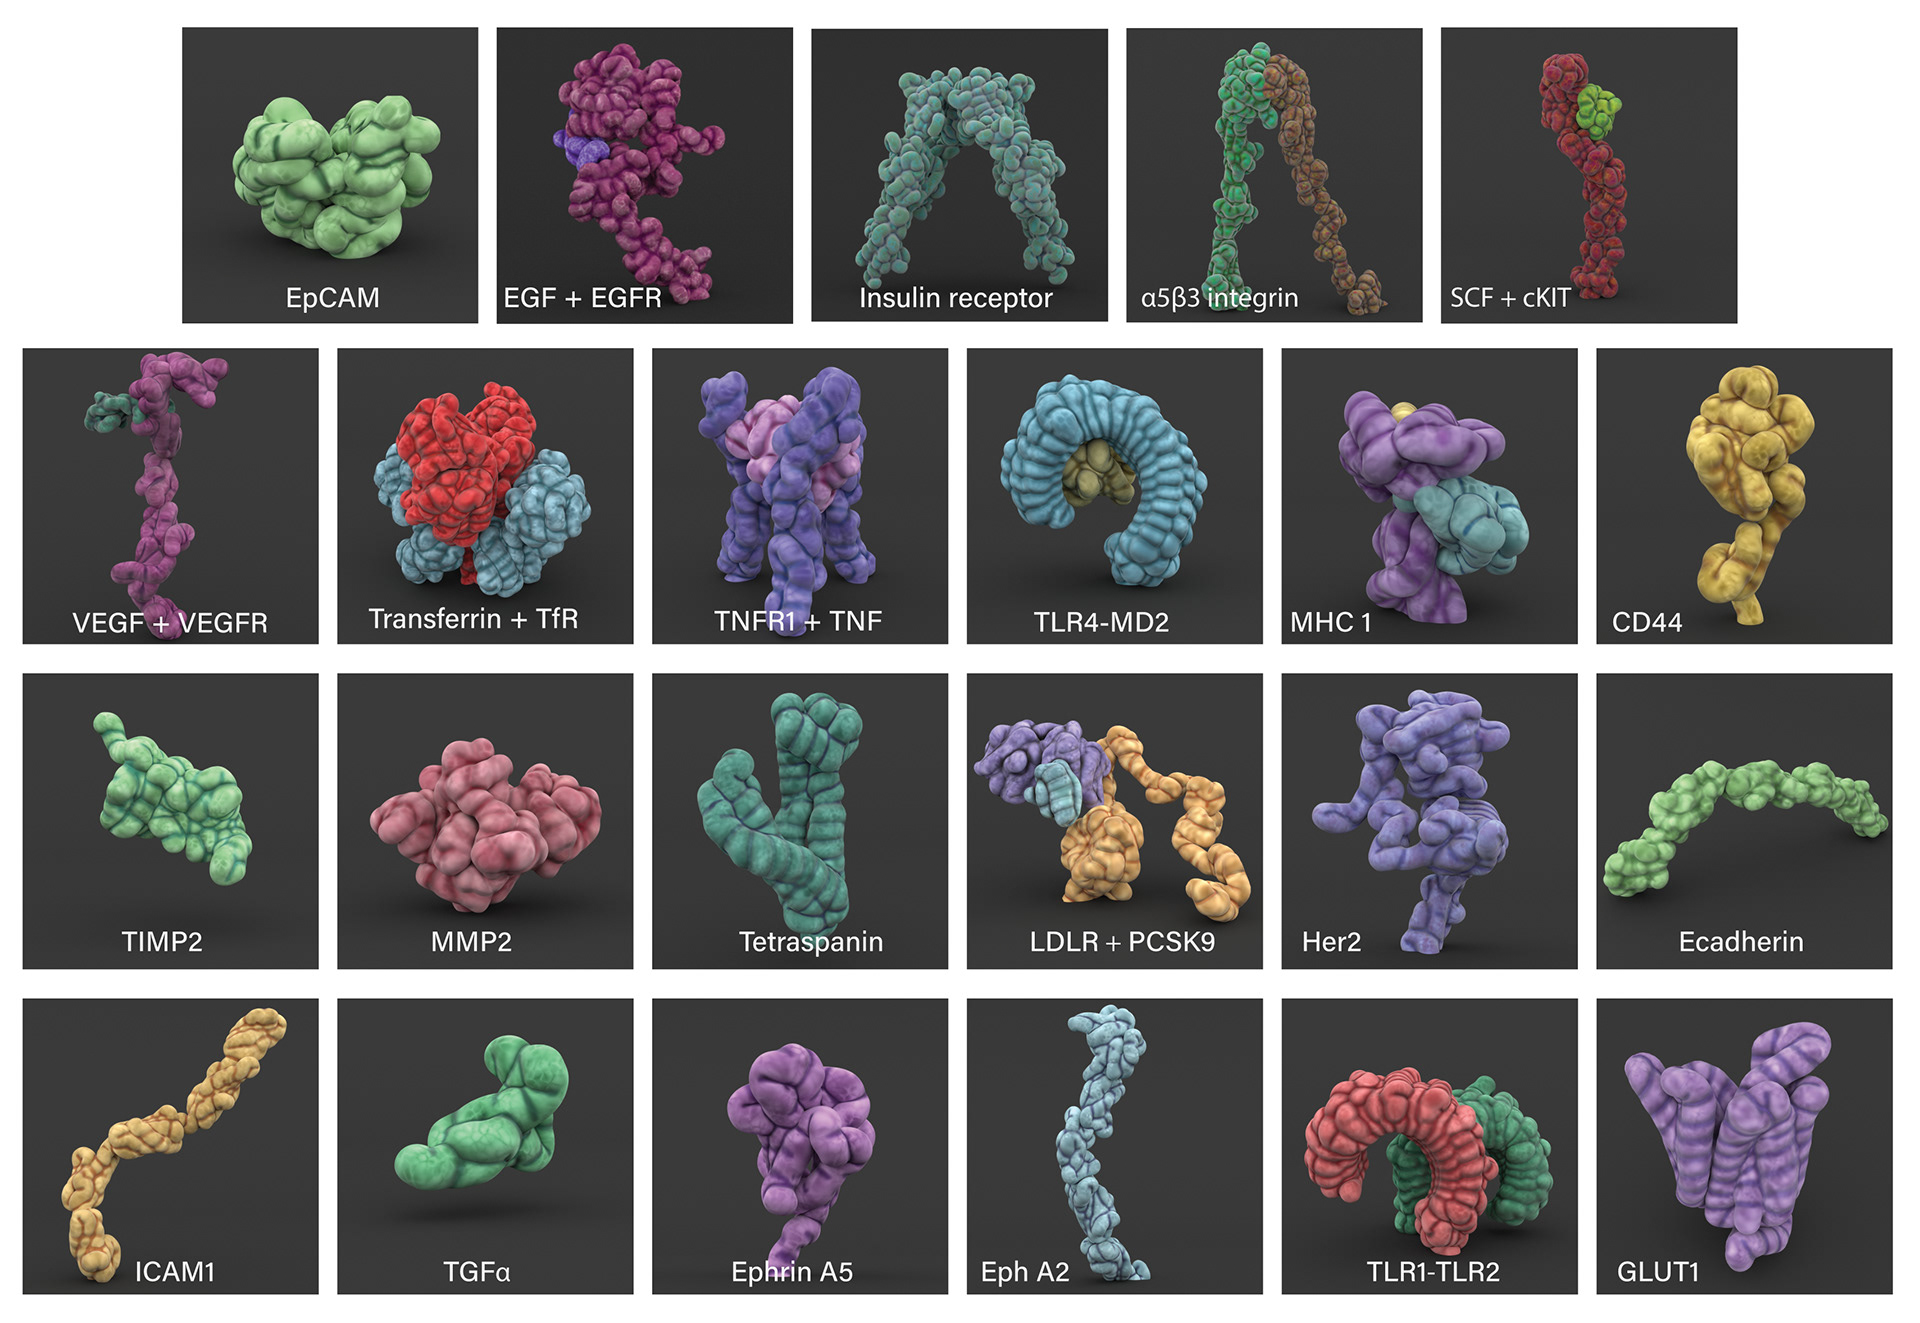
Stylised 3D cell surface receptor and ligand meshes modelled from structures retrieved from the PDB (protein data bank).
Most proteins are depicted as monomers.
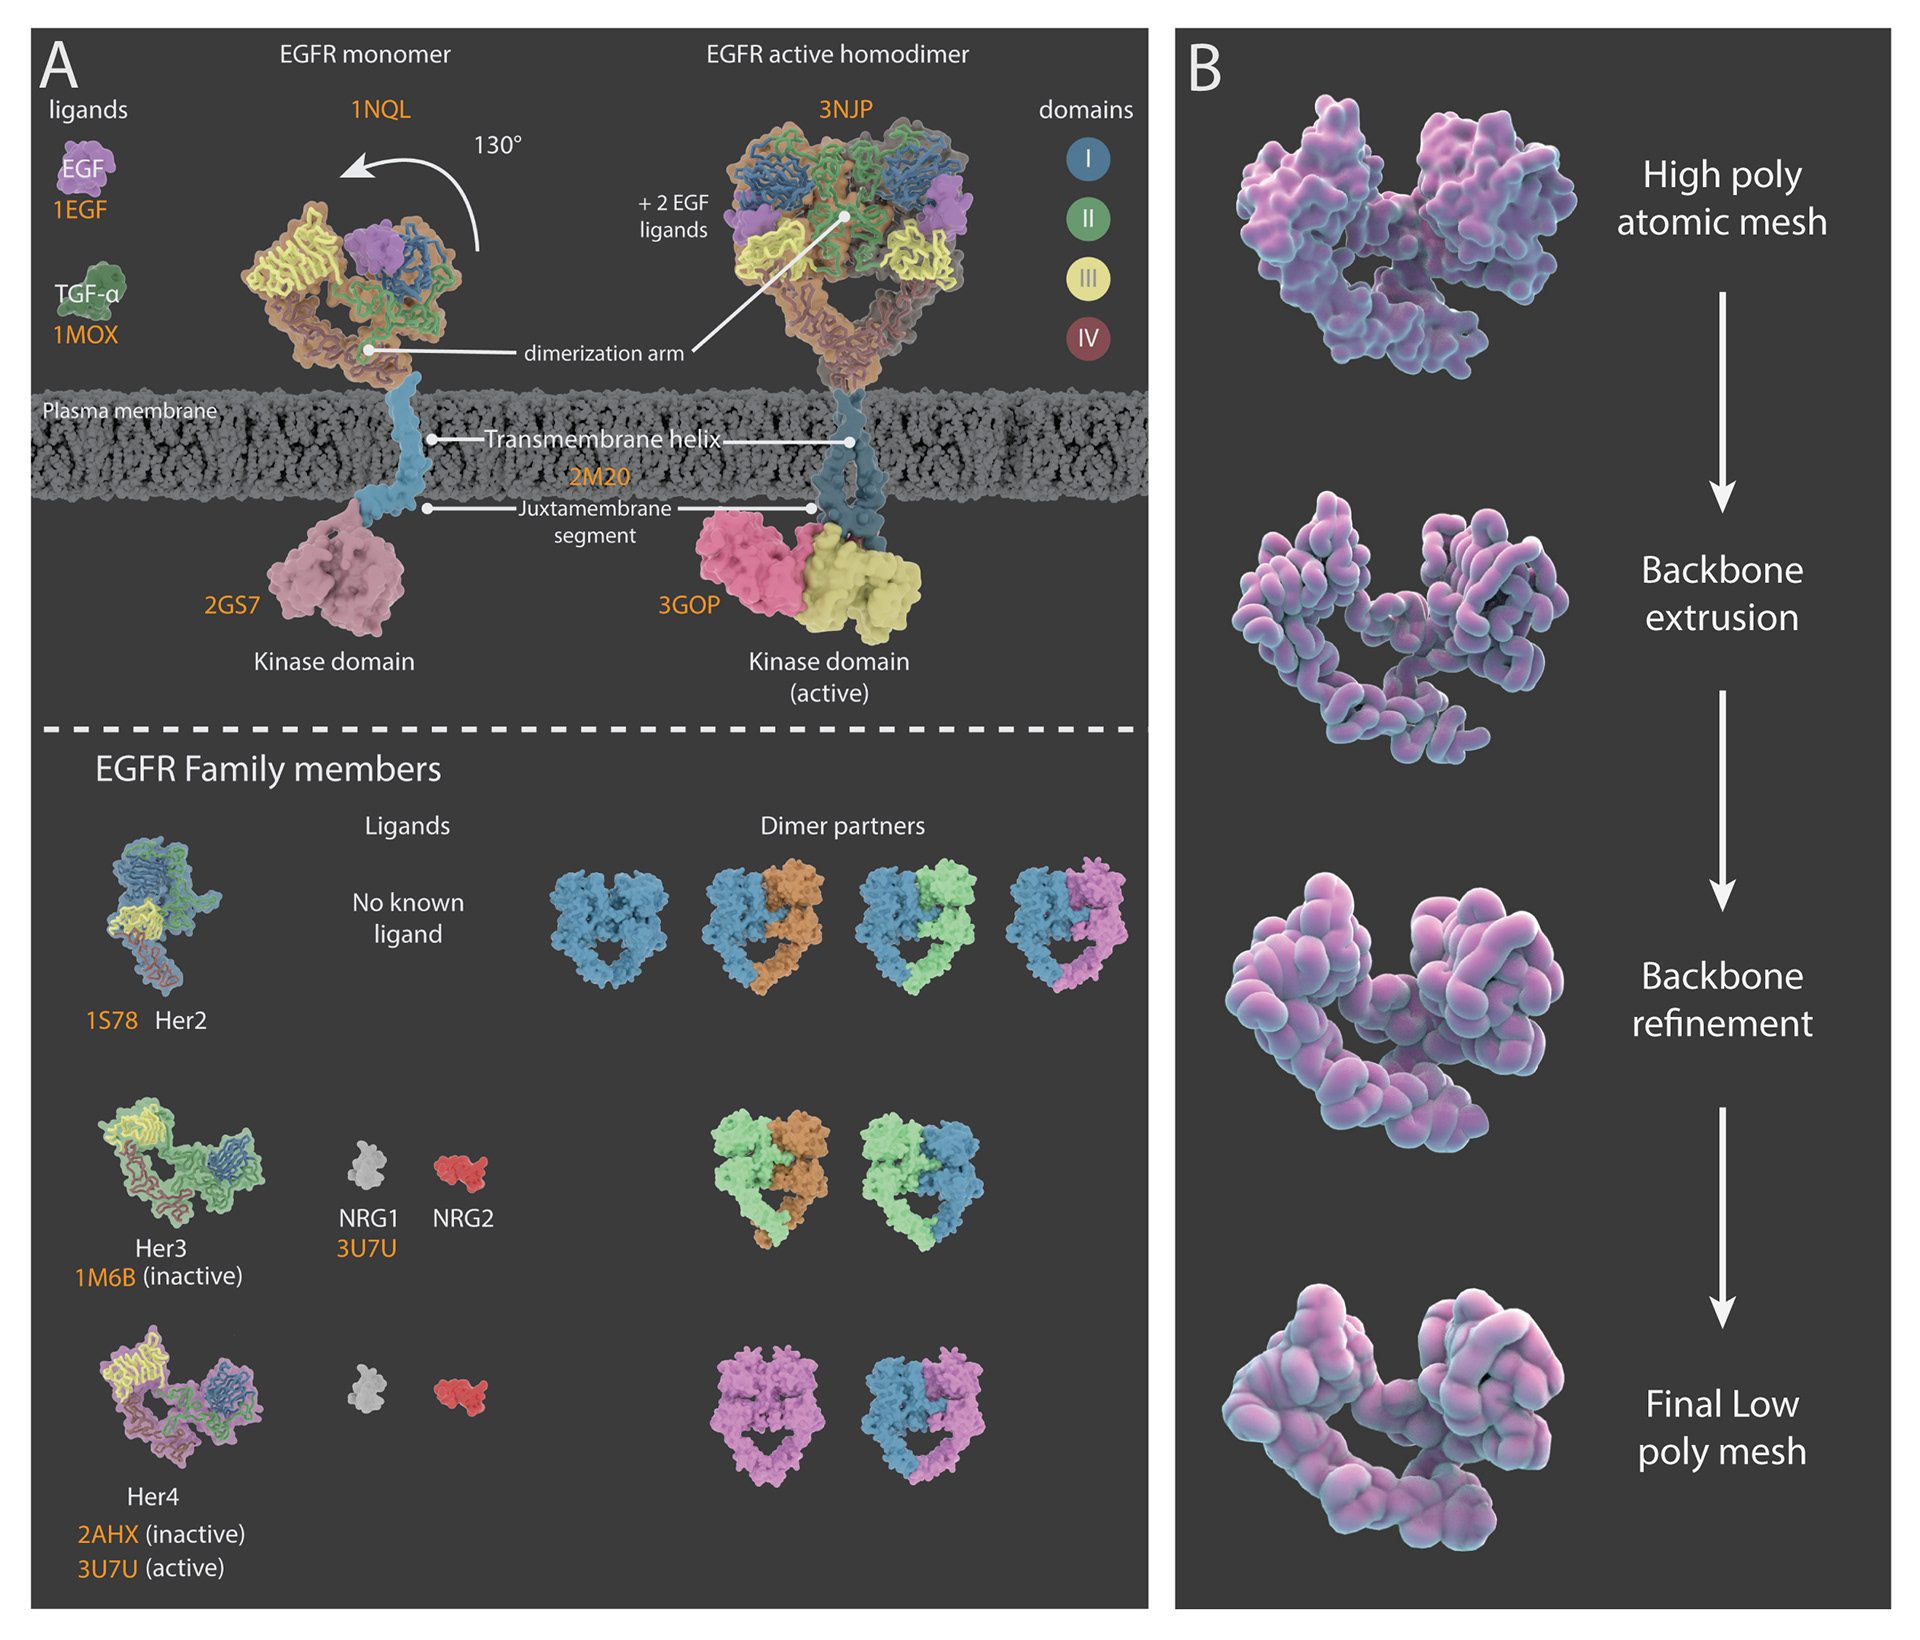
3D representations of surface receptors.
(A) Summary of structural and dynamic information collected about the ErbB family of proteins for creation mechanism of action animations. PDB structures meshes (orange text) for ErbB family members (EGFR, Her2, Her3, and Her4) and their ligands. Top: mechanism of action for EFGR which upon ligand binding the inactive monomer undergoes a conformational change (130° movement), into the active extended conformation and dimerization with another active EGFR protein can occur. Bottom: Her2, Her 3 and Her 4 PDB structures and dimer partner combinations. (B) Creation of stylised protein meshes. Original high poly atomic structures sourced from the PBD have their backbones extruded and refined to produce a low poly stylised mesh.
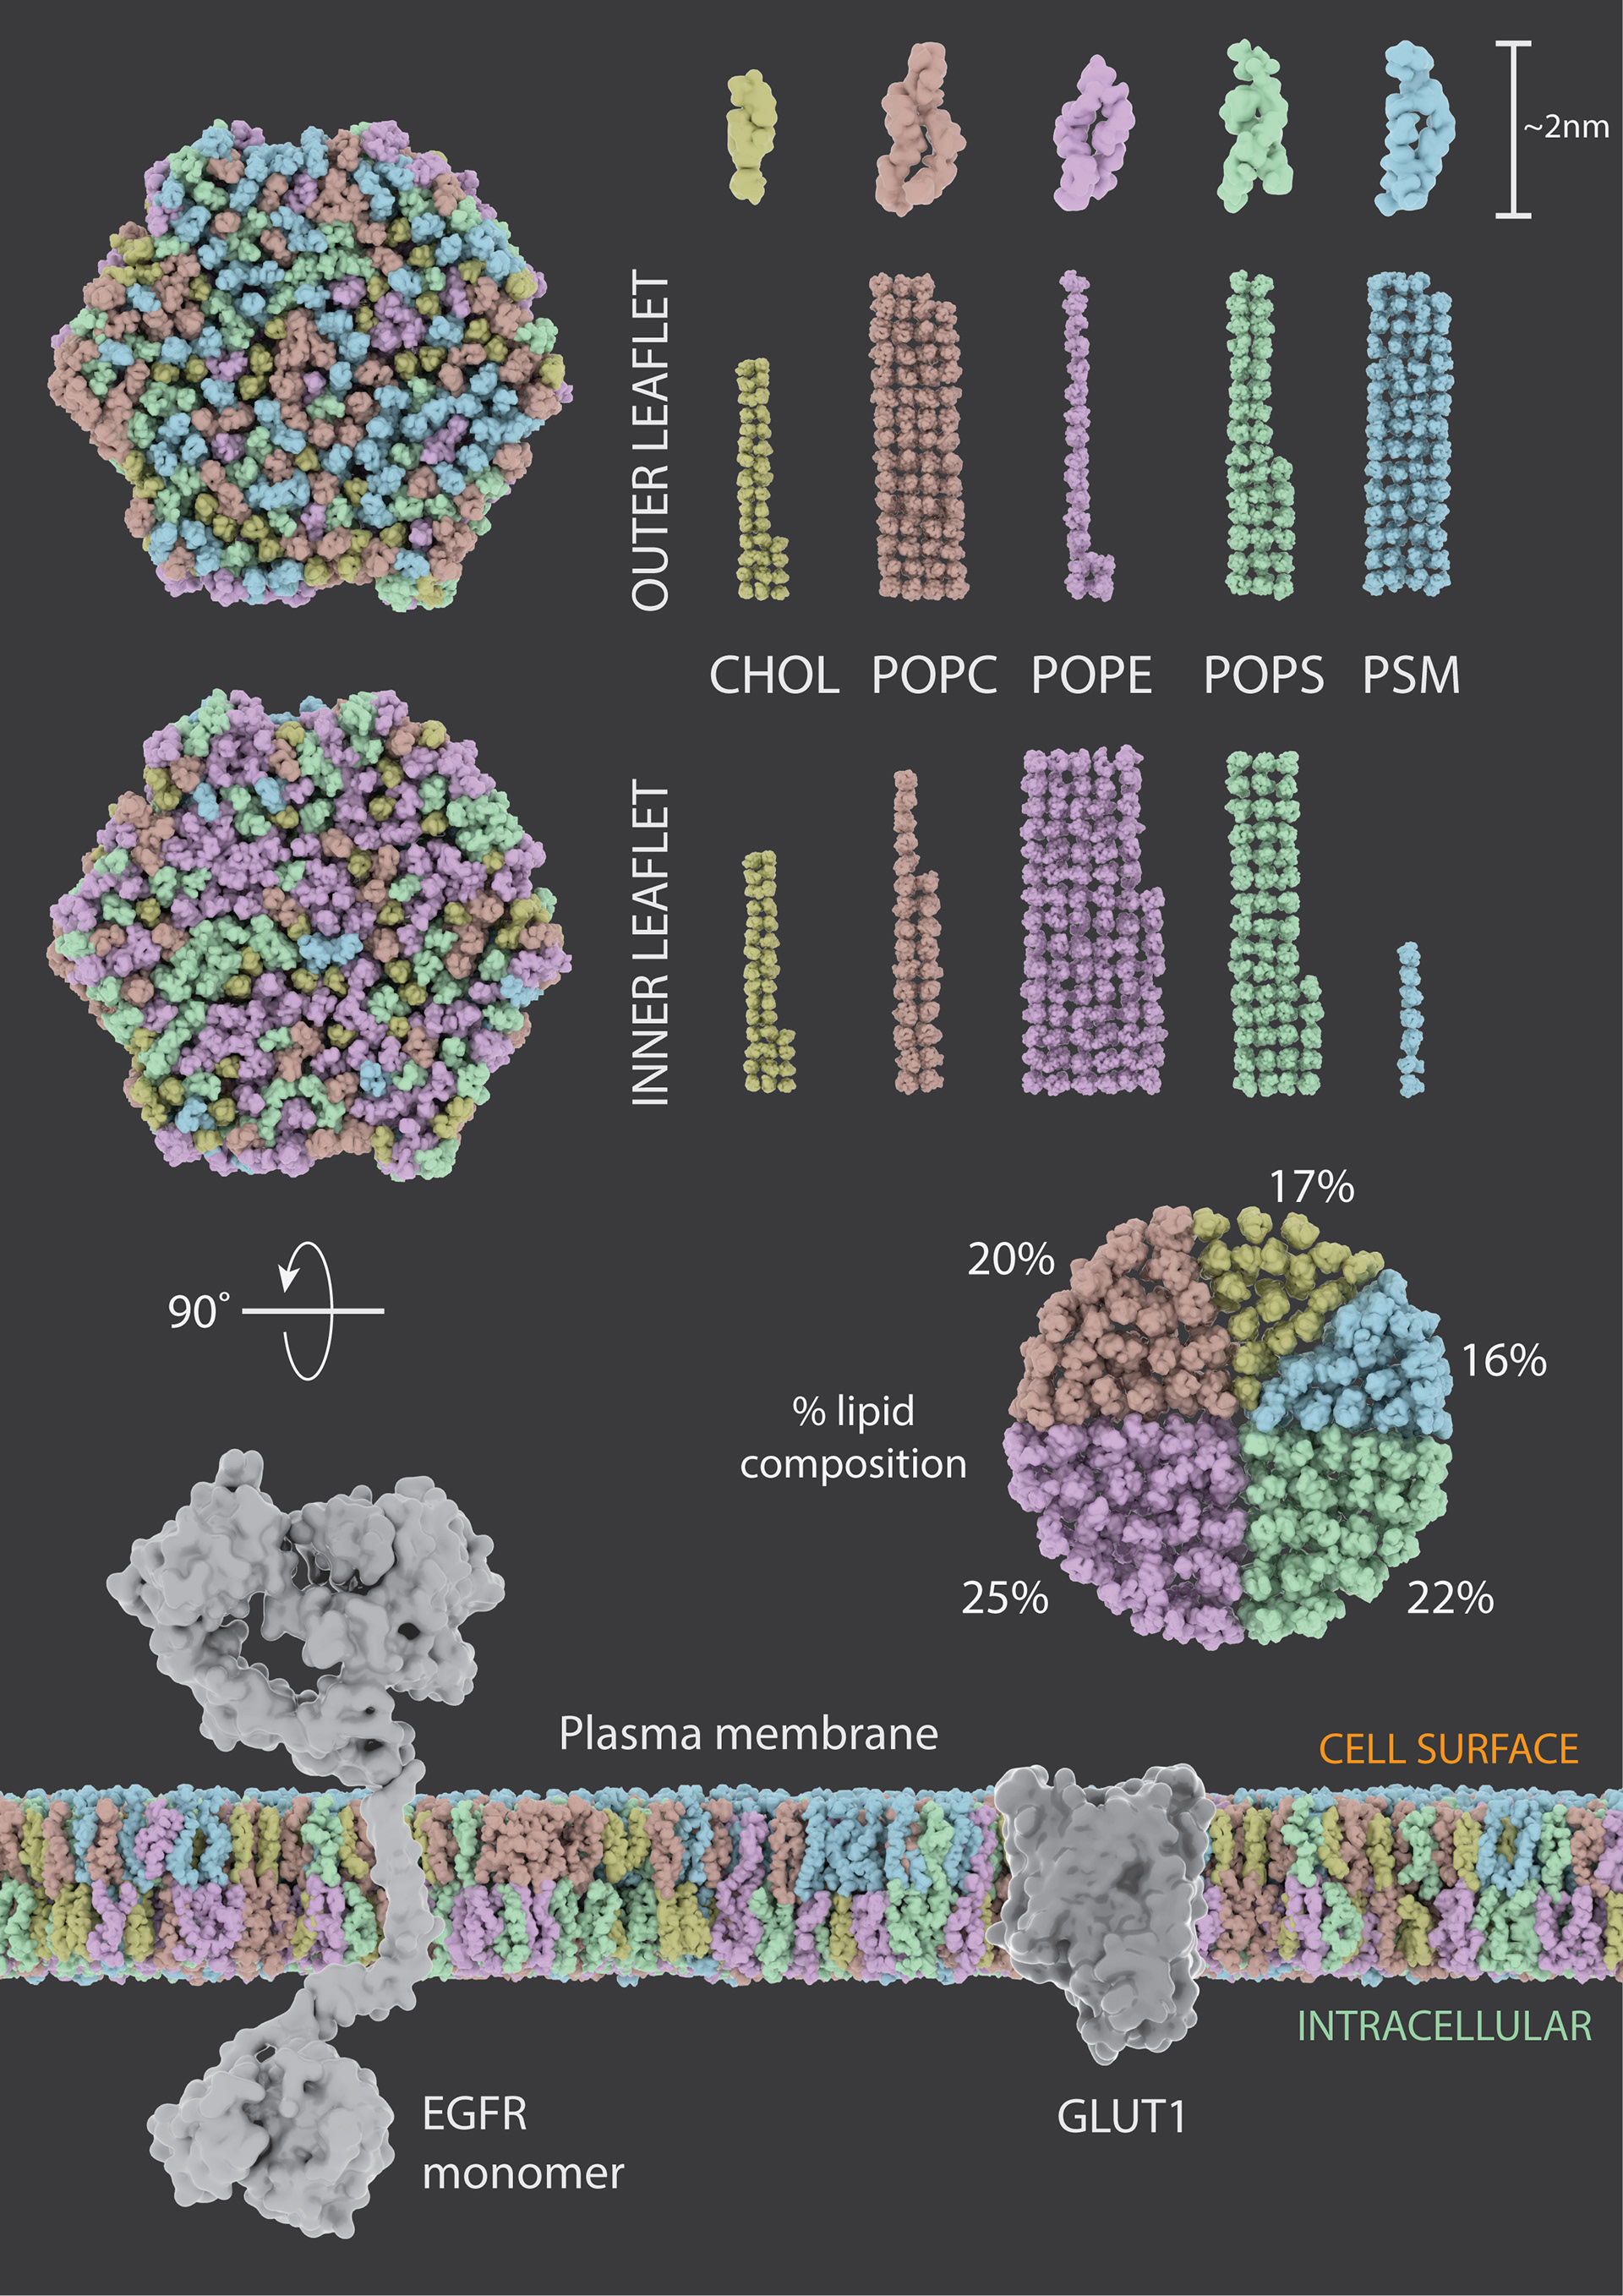
3D representations of plasma membrane lipids.
A 3D model composition of a representative cancer lipid bilayer highlighting an asymmetric distribution of 400 lipids. Bilayer components include cholesterol (CHOL), 1-palmitoyl-2-oleoyl-sn-glycero-3-phosphocholine (POPC), 1-palmatoyl-2-oleoyl-sn-glycero-3-phosphoethanolamine (POPE), 1-palmitoyl-2-oleoyl-sn-glycero-3-phospho-L-serine (POPS), and palmitoylsphingomyelin (PSM). Bar charts plot the proportion of each lipid species within the outer and inner leaflets; pie chart represents the percentage lipid compositions within the bilayer. Side view illustration of a model cancer plasma membrane with proteins EGFR and GLUT1.
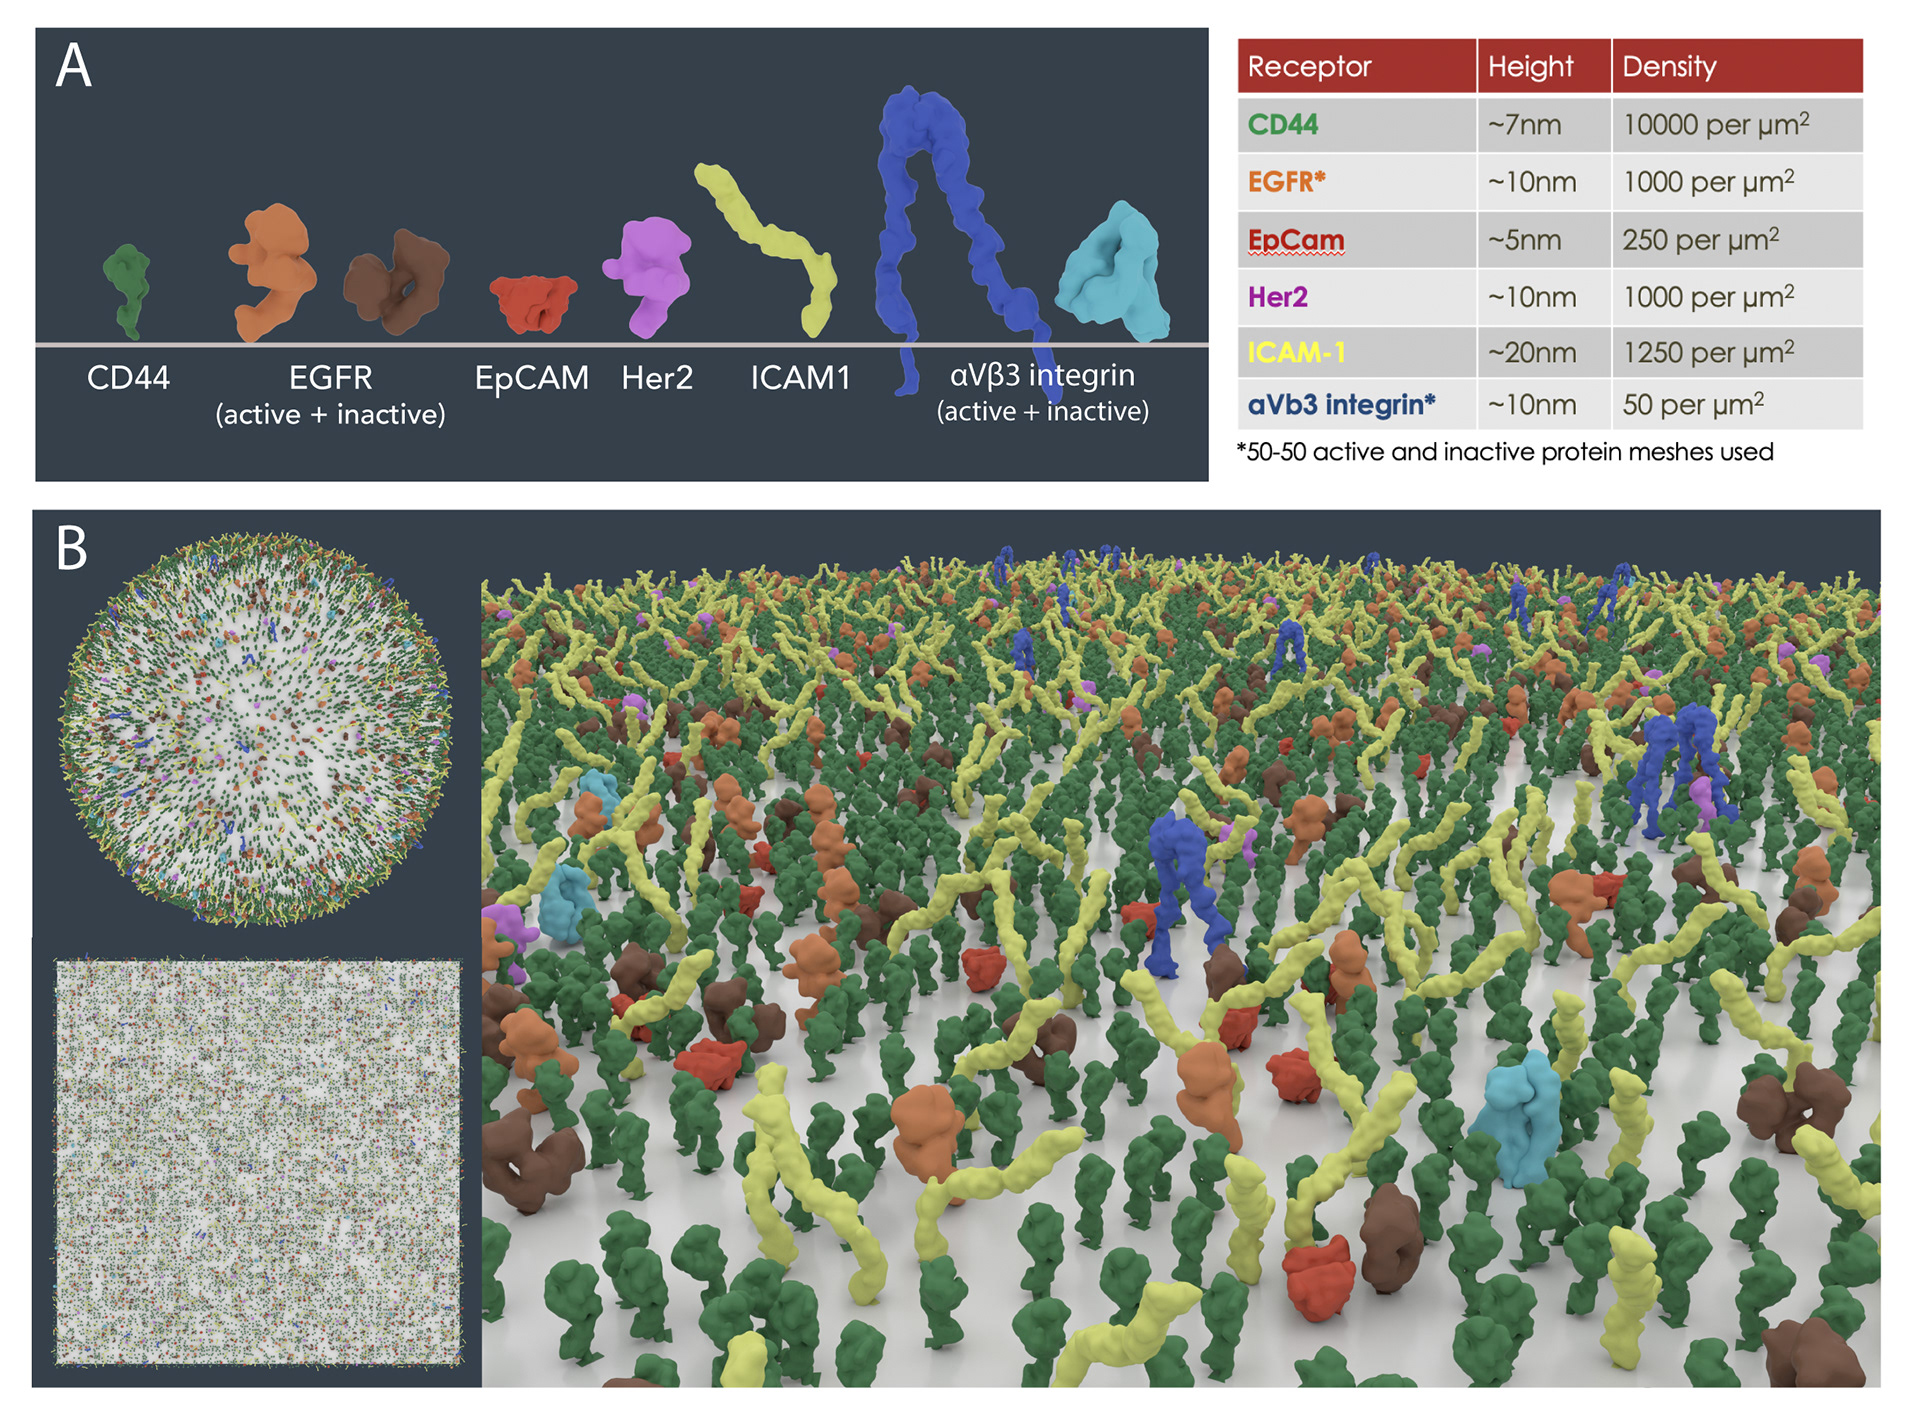
3D cell surface receptor density modelling from experimental data.
(A) PDB meshes of 6 well-known surface biomarkers (CD44, EGFR, EpCAM, Her2, ICAM1 and αVβ3 integrin) on MDA-MB-231 cells from flow cytometry data. (B) Scaled receptor meshes were distributed onto a 1μm2 surface area sphere and plane using the autoPACK plugin in Blender.
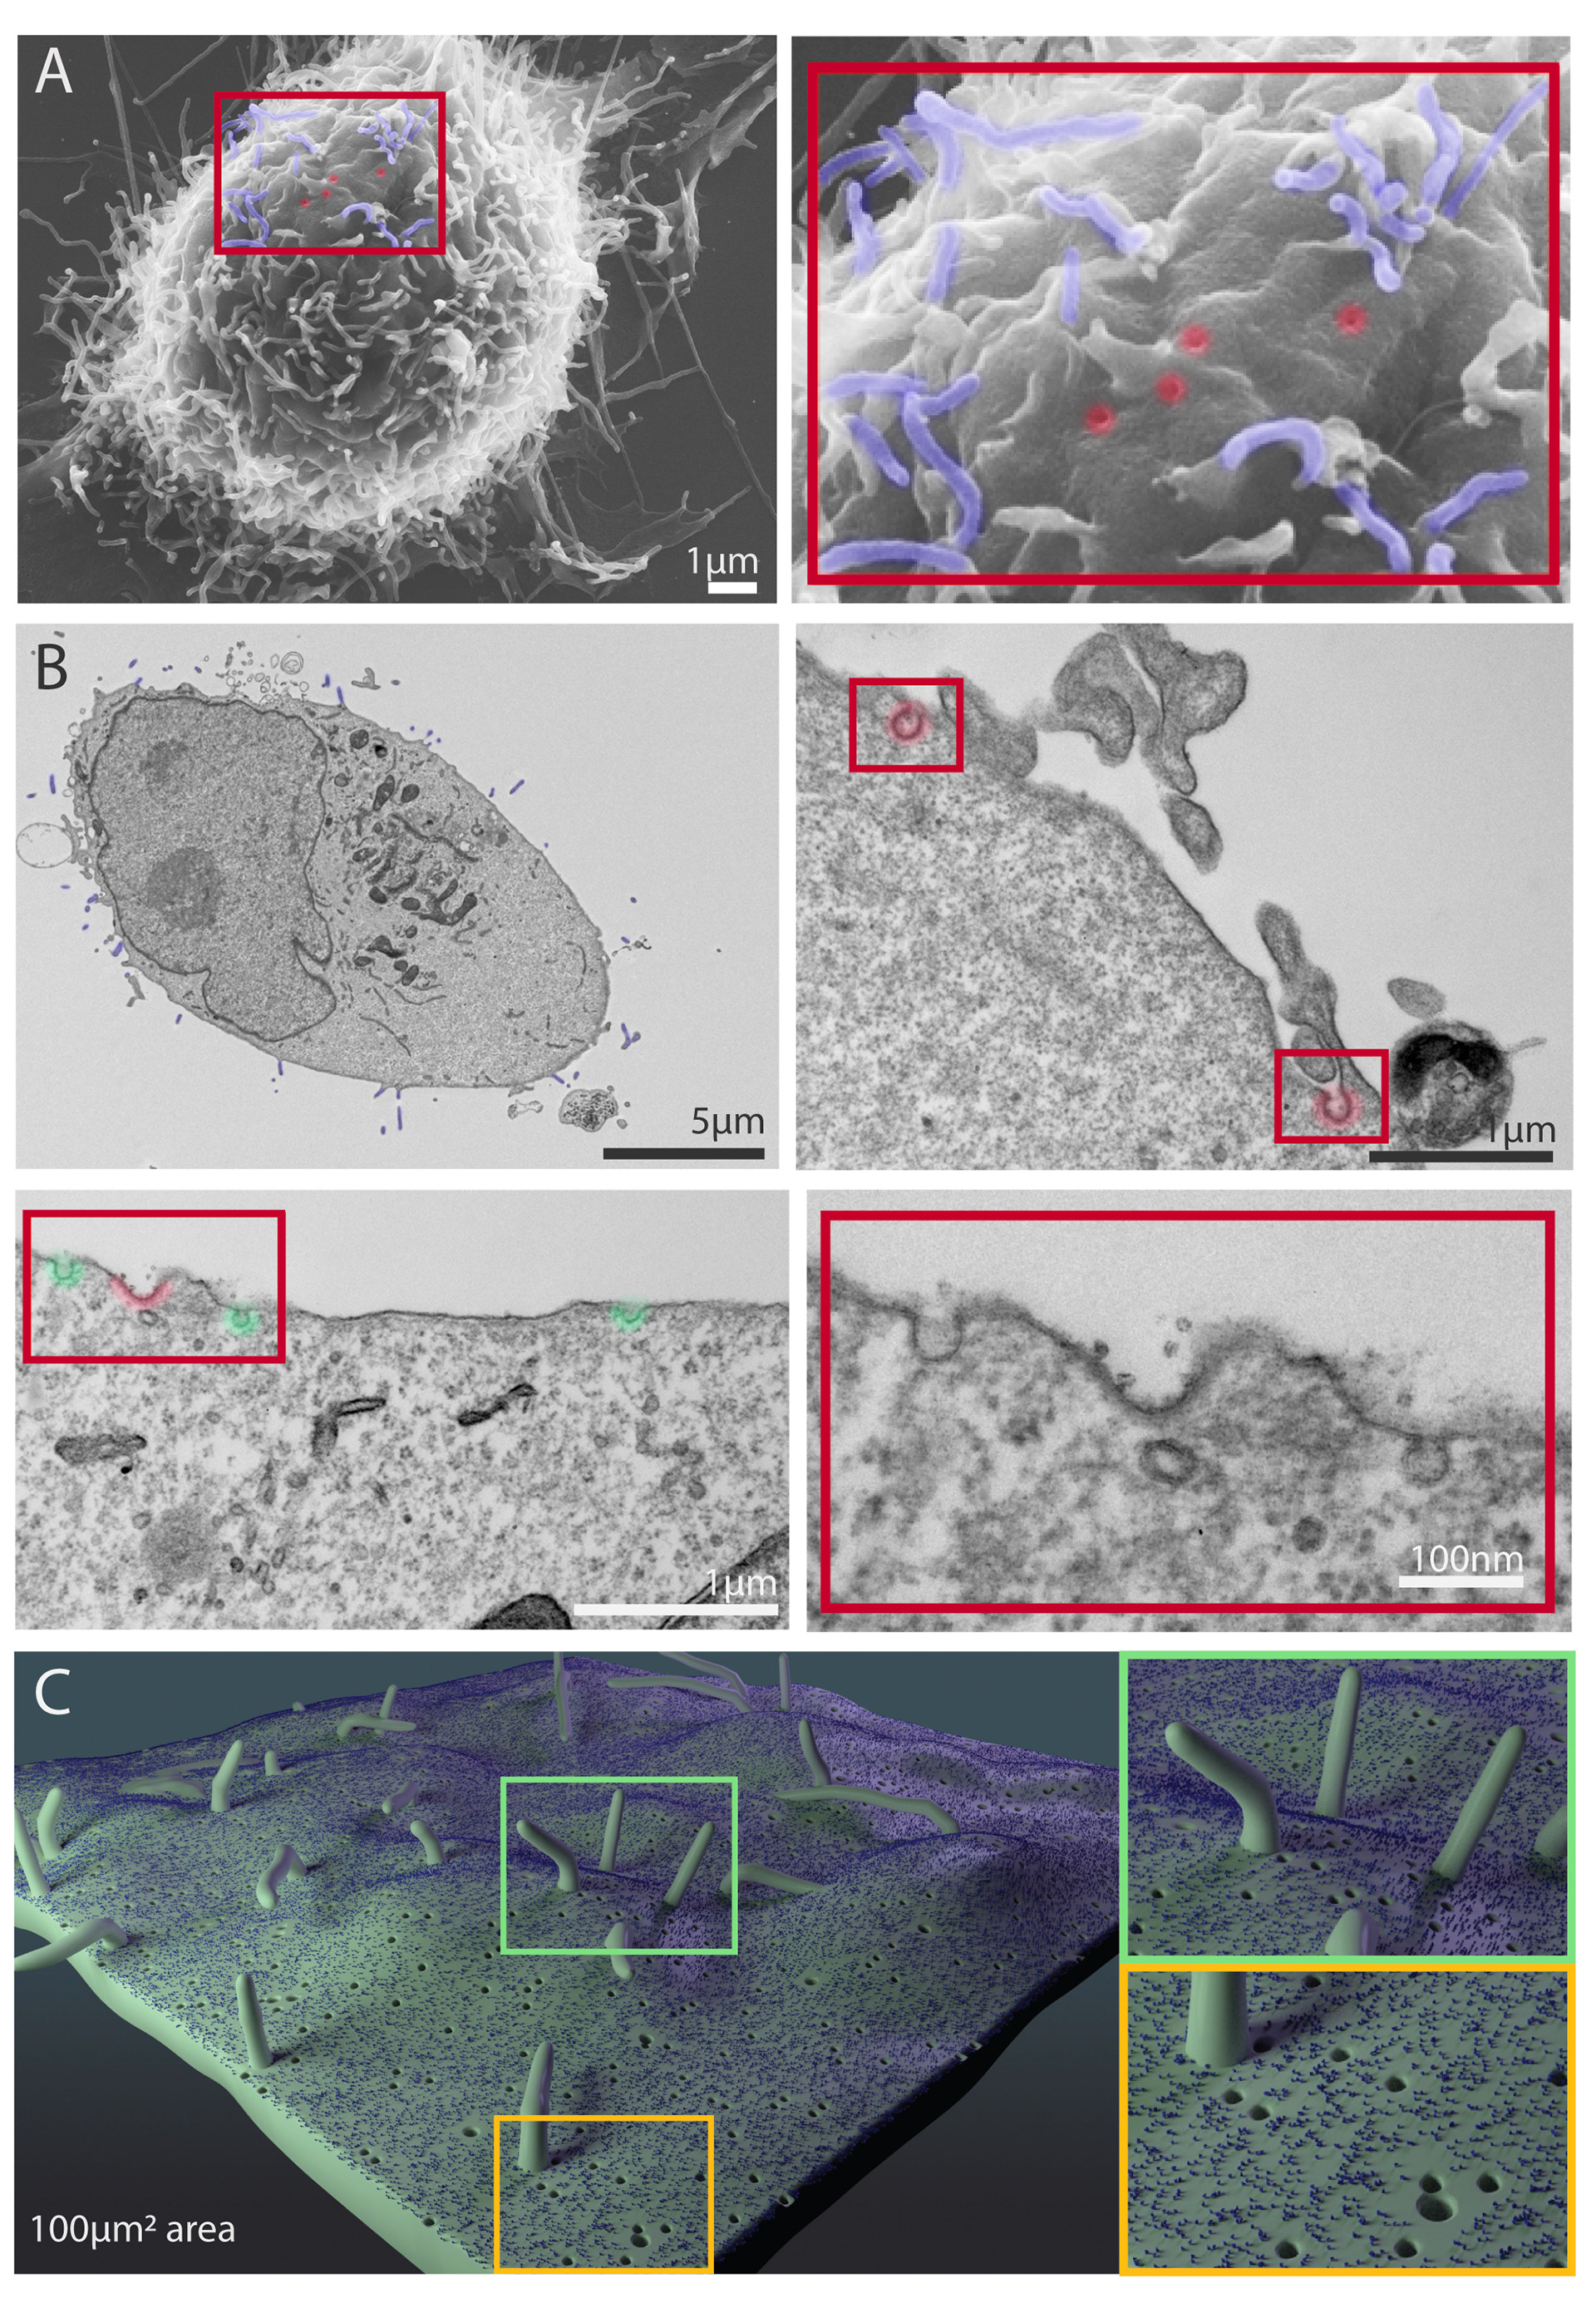
Representative SEM and TEM images of MDA-MB-231 cells showing cellular features used in Nanoscape.
(A) Representative SEM images of MDA-MB-231 cells. The boxed area shows filopodia (pseudocoloured blue) and putative pits (caveolae, clathrin coated pits) in red. (B) Representative TEM images of sections of MDA-MB-231 cells. Filopodia are pseudocoloured blue, clathrin coated pits red, and caveolae green. Lower right panel shows higher magnification view of boxed area in adjacent image. (C) 3D depiction of accurate scales and densities of filopodia, caveolae, clathrin coated pits, and a representative receptor on a 100μm2 patch of cell membrane.
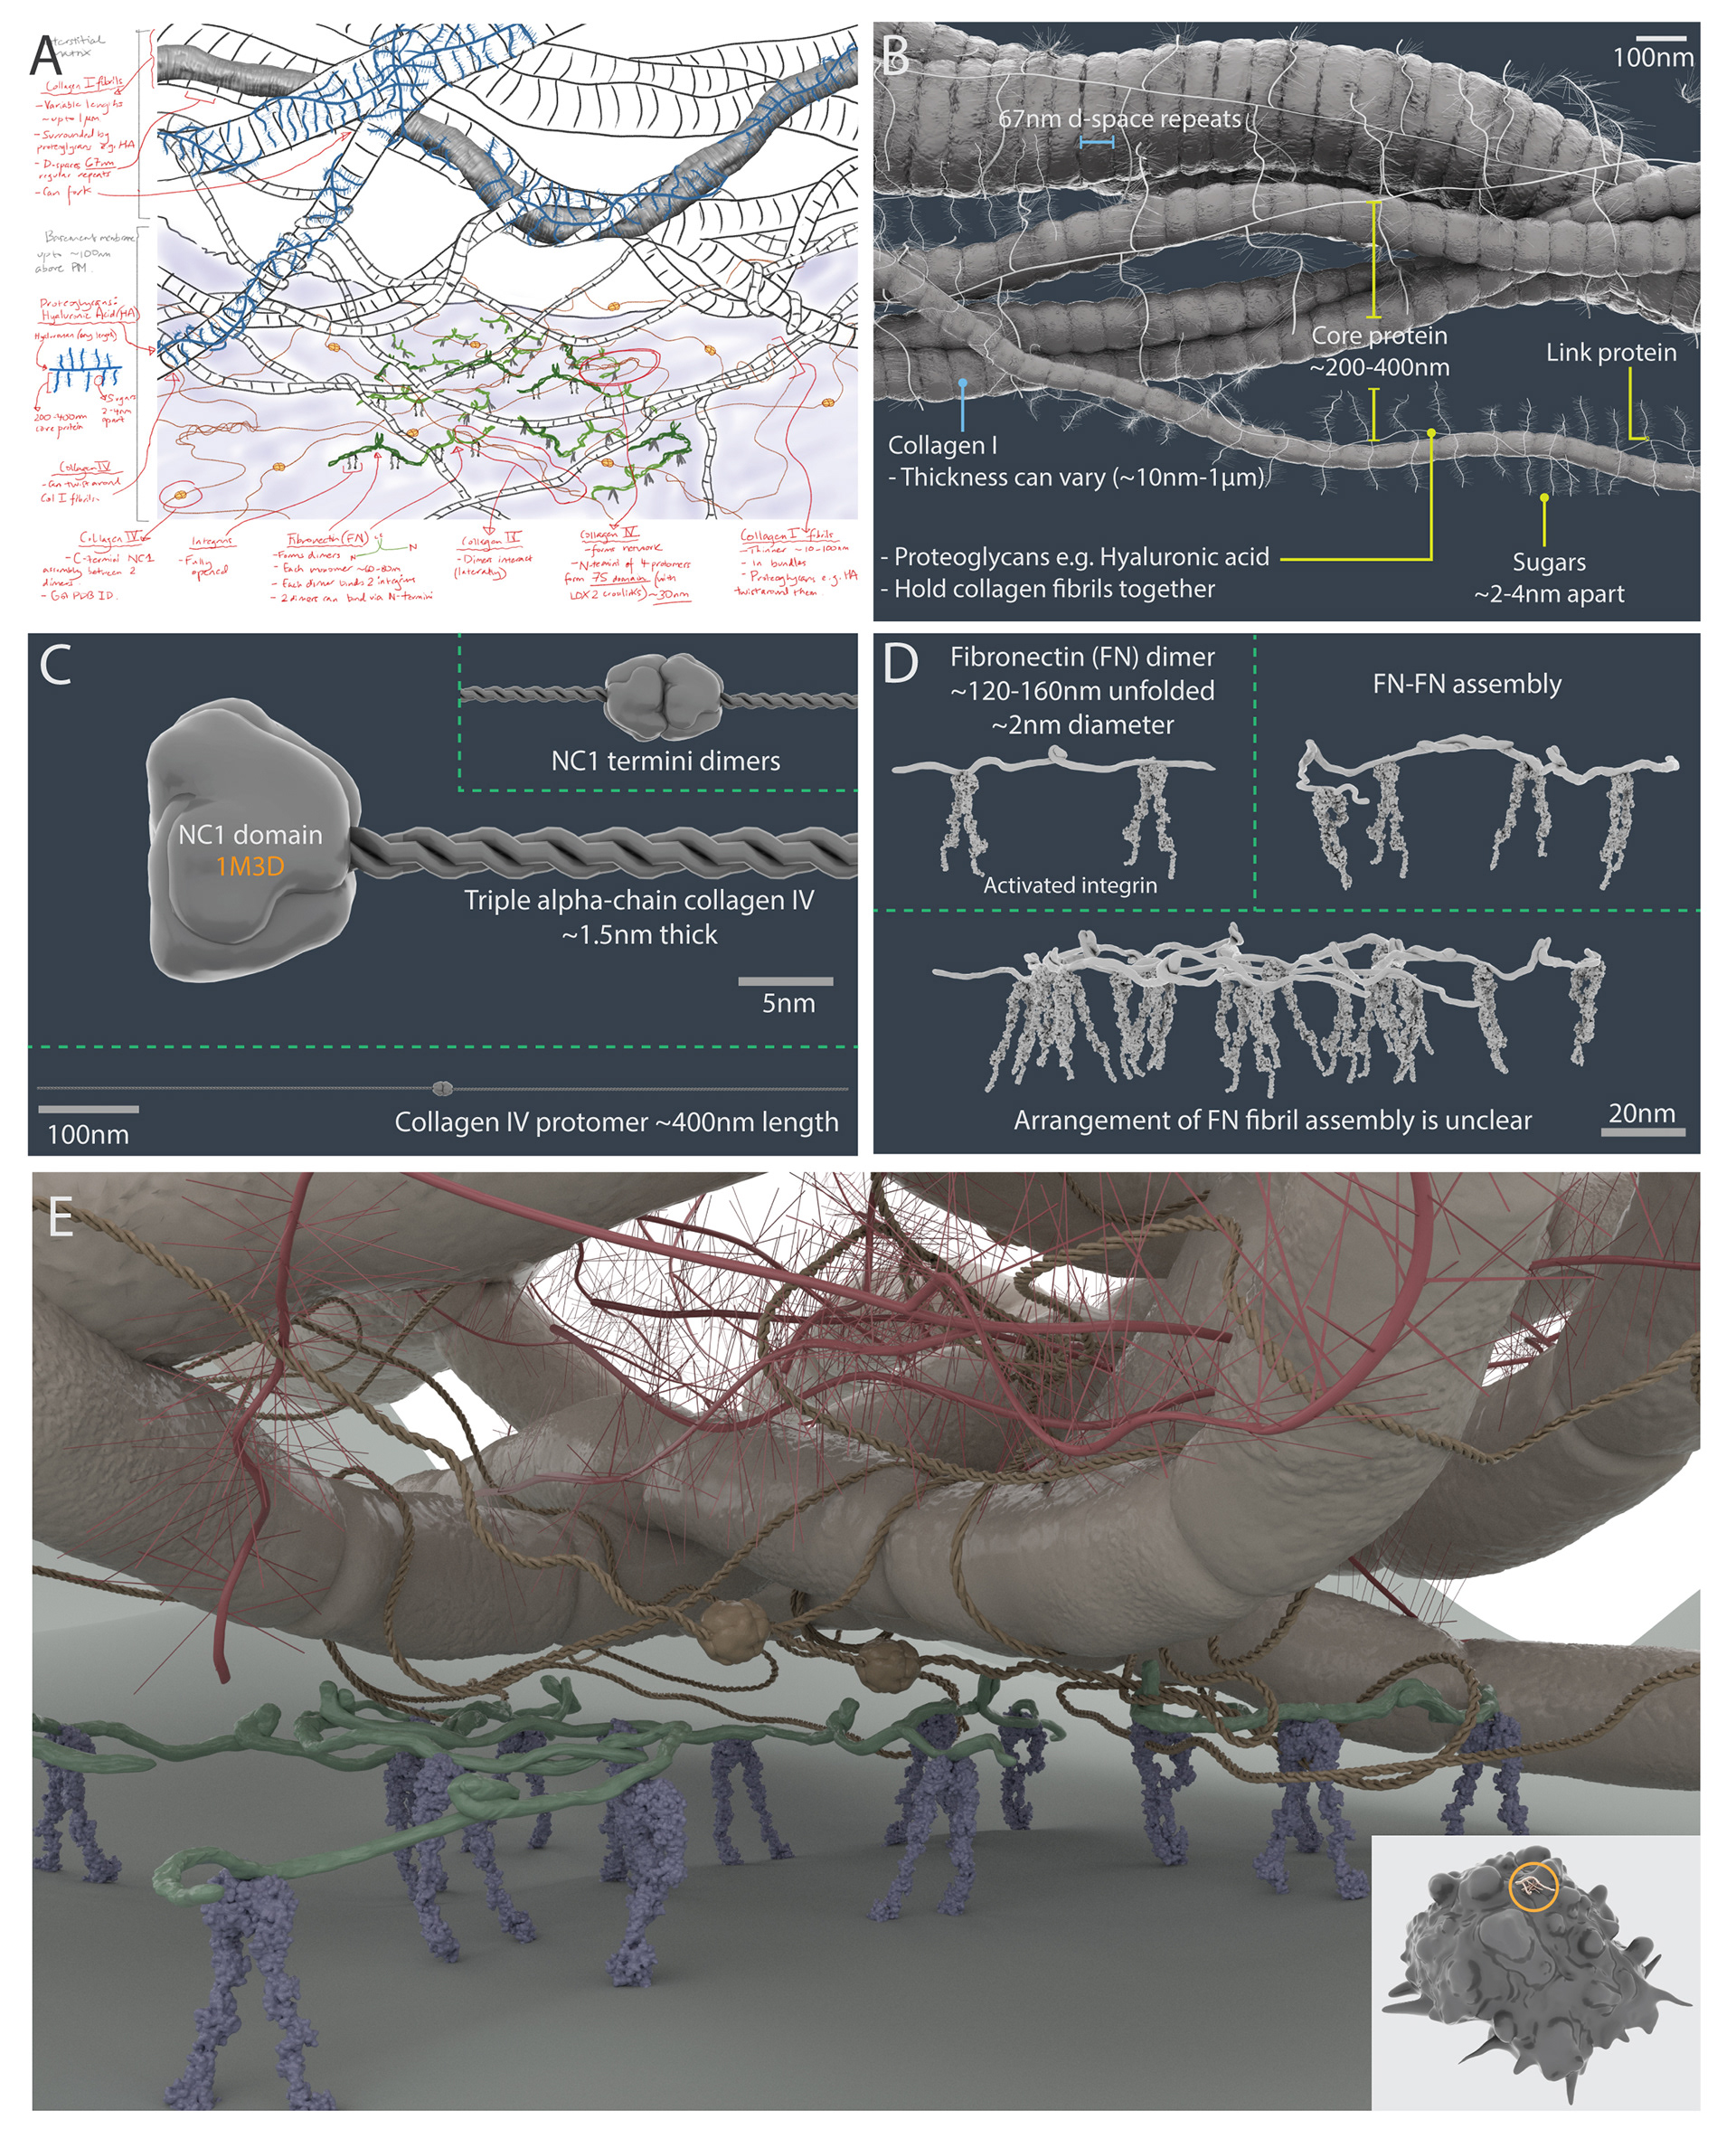
A 3D artistic impression of ECM in a tumour microenvironment.
(A) Pre-production sketch layout of the scene. Scaled 3D models of collagen I fibrillar bundles and proteoglycans (e.g. hyaluronic acid) (B), collagen IV protomers and dimers (C), fibronectin dimers bound to active αVβ3 integrin (D).
(E) Rendered 3D artistic interpretation of the ECM in a tumour microenvironment. Insert shows the scale of the modelled area (circle) relative to a breast cancer cell model (10μm diameter).
(E) Rendered 3D artistic interpretation of the ECM in a tumour microenvironment. Insert shows the scale of the modelled area (circle) relative to a breast cancer cell model (10μm diameter).
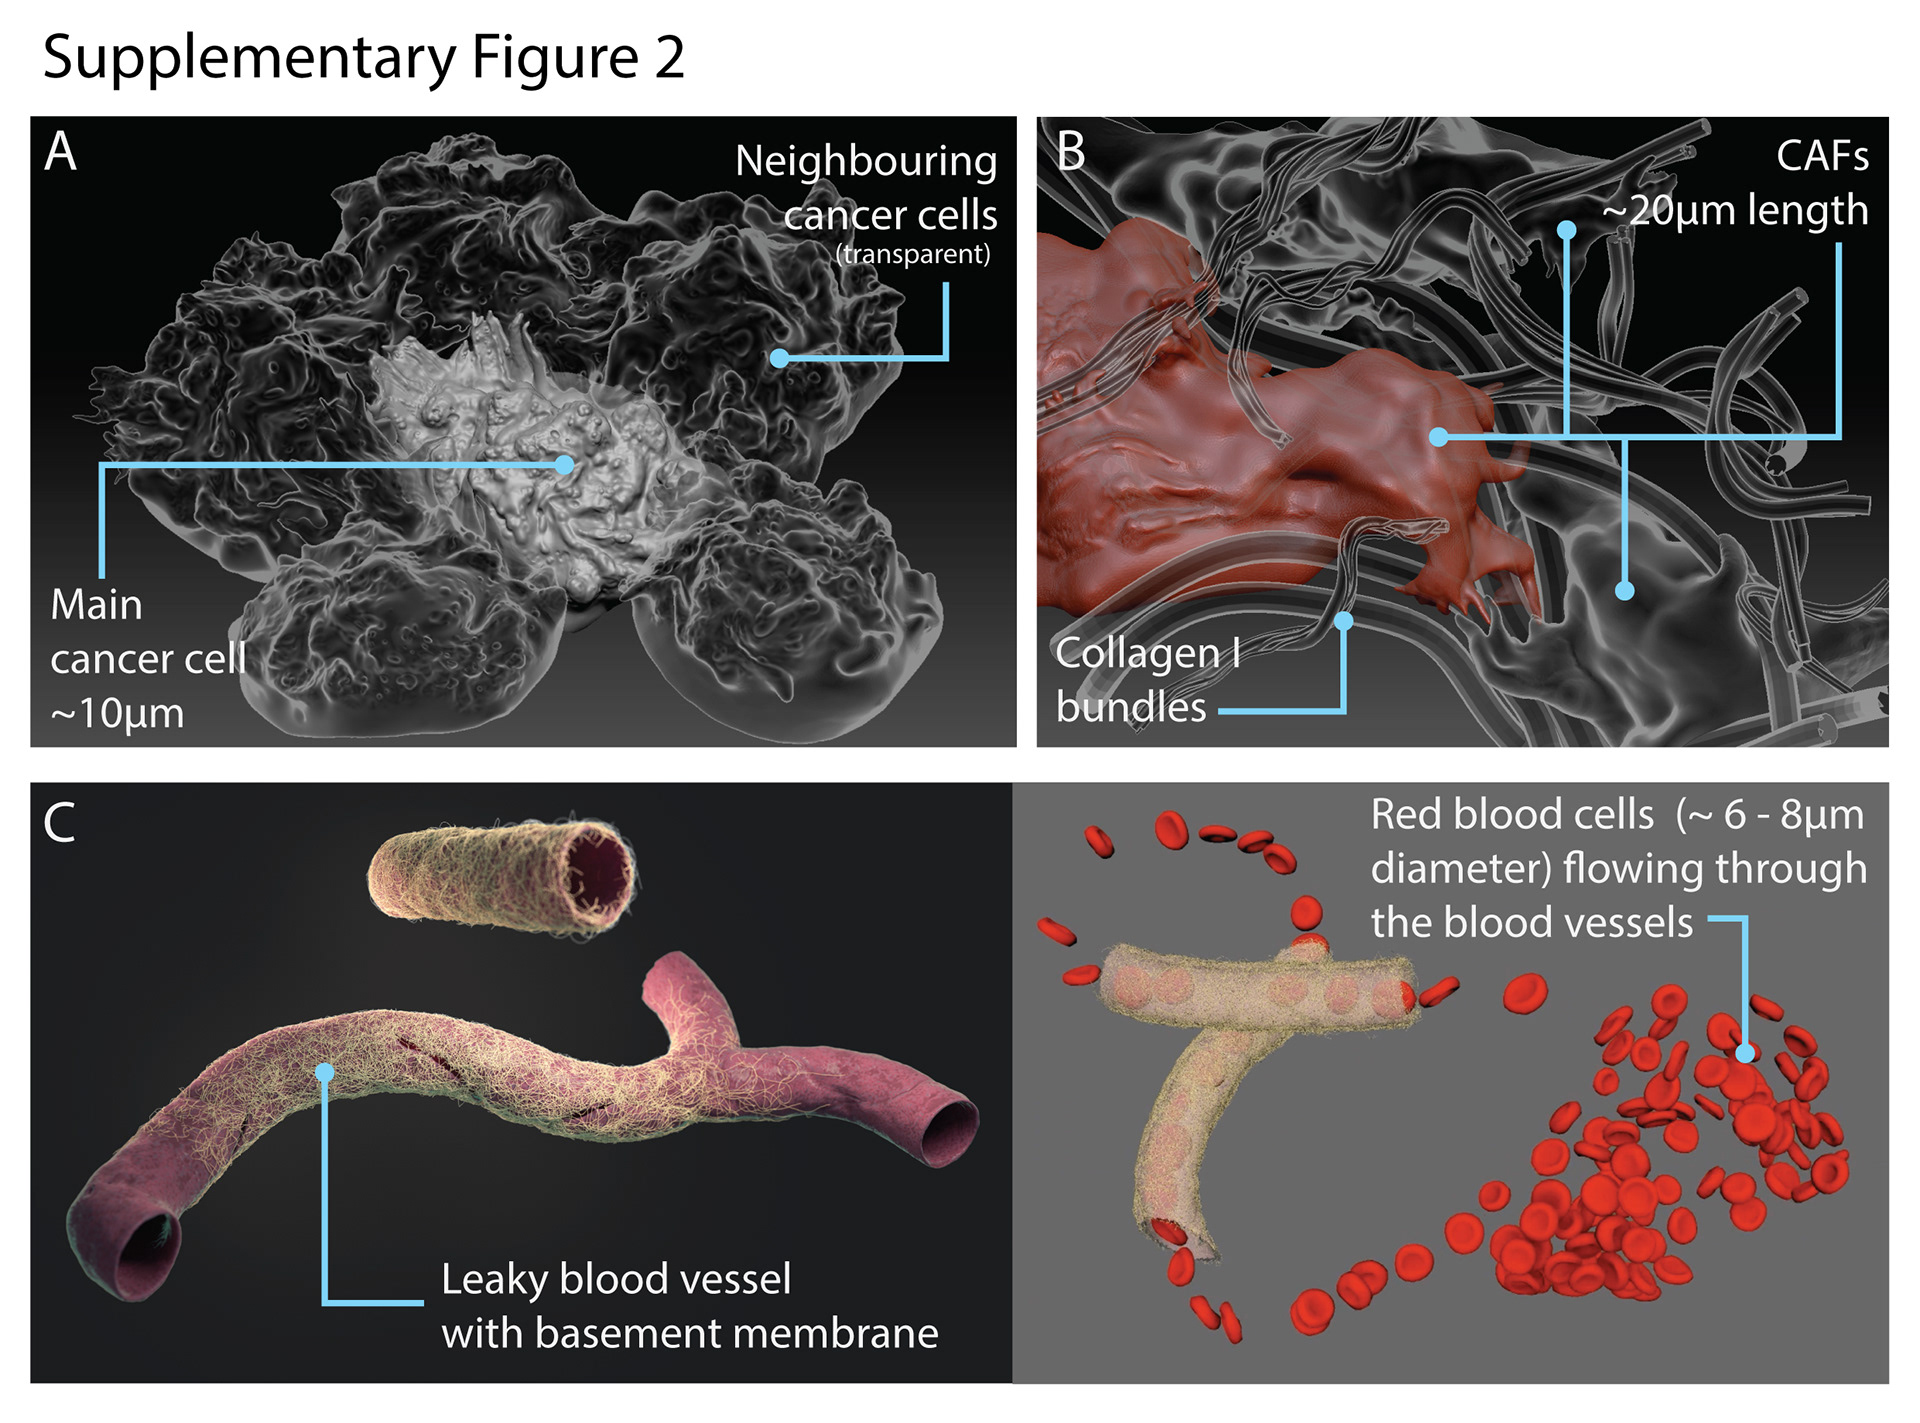
Models of components in the tumour microenvironment.
(A) Additional neighbouring cancer cells (transparent) surrounding the central (play area) cancer cell. (B) Cancer-associated fibrolasts (CAFs) entangled in collagen fibres. (C) Leaky blood vessel surrounded by basement membrane mesh (left); snapshot of animation with red blood cells flowing through the vessel